Portfolio release · Service validated
Sales & inventory decision intelligence
From operational noise to one trusted view.
NovaTrade turns six years of synthetic distribution data into a governed SQL Server warehouse, a star-shaped semantic model, and five focused Power BI decision experiences.
Synthetic by design. No real company, customer, employee, or transaction data is used.
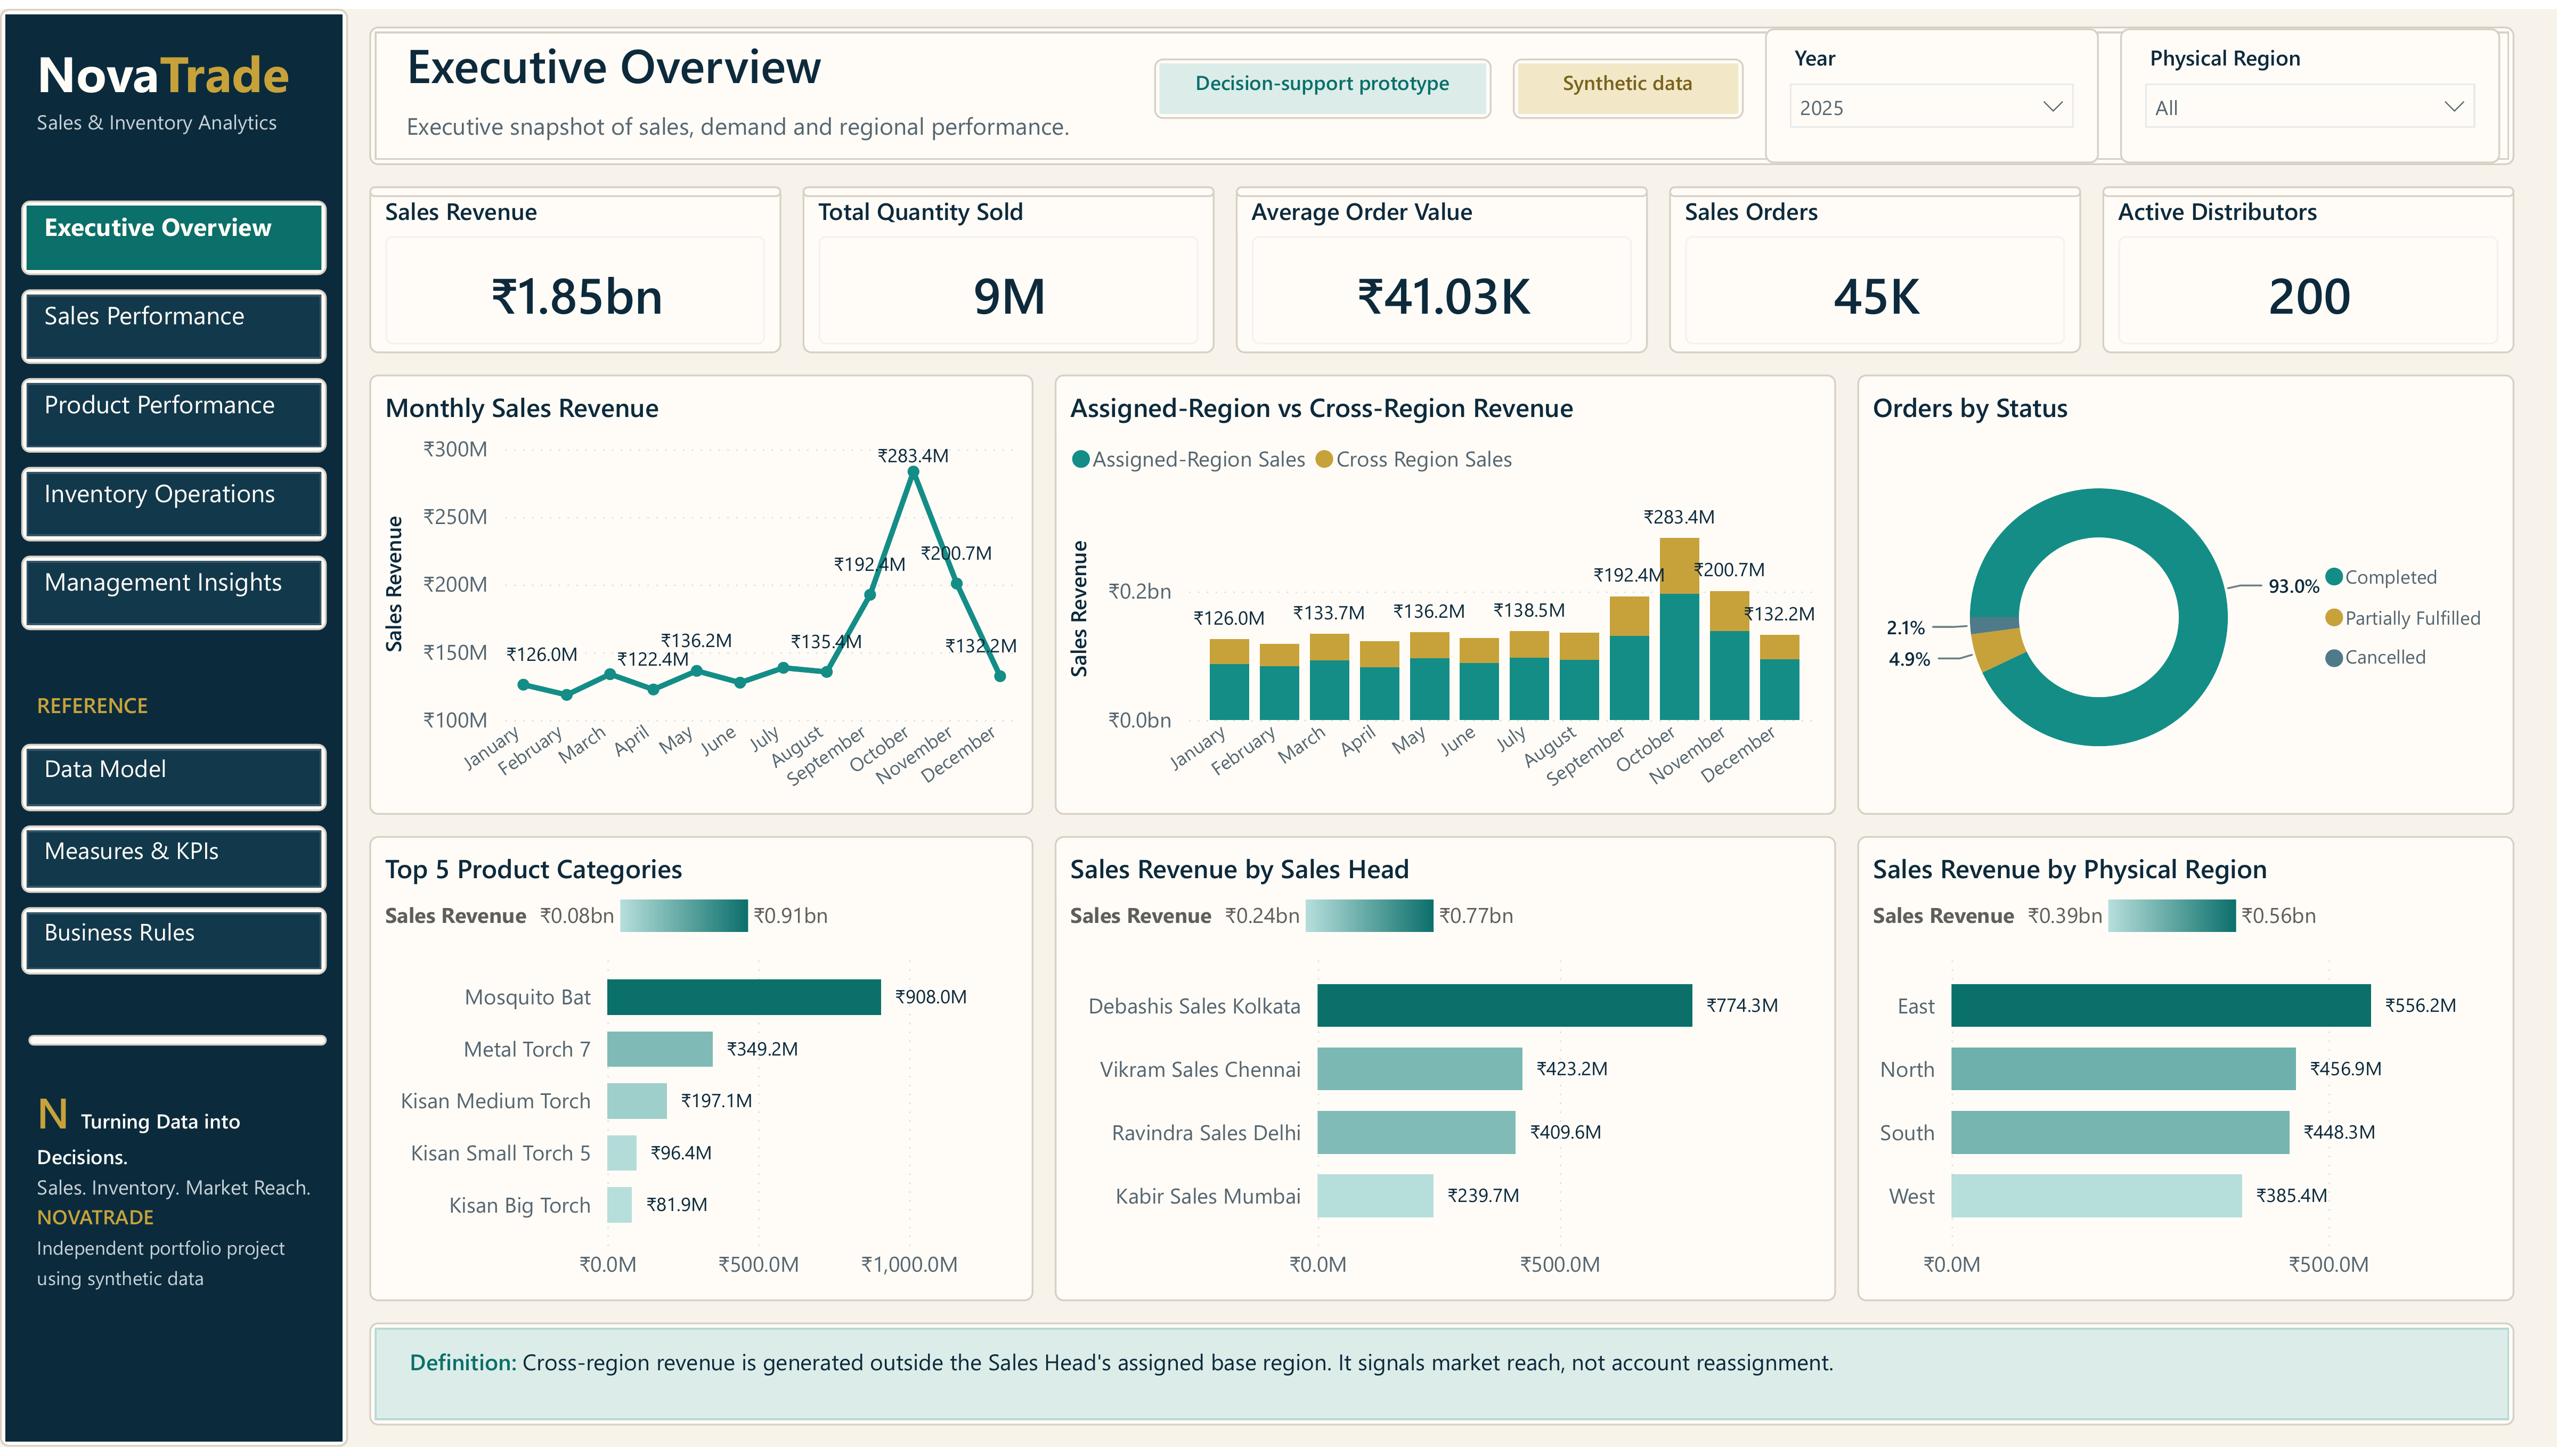
NovaTrade · Executive Overview · 2025
81 measures
12 / 12 validators passed
The business problem
Growth is hard to manage when every answer lives in a different file.
Fragmented performance
Sales, orders, distributors, products, territories, and inventory are difficult to reconcile across separate operational views.
Weak accountability
Leaders need a clear distinction between assigned-region sales and legitimate cross-region market reach.
Late inventory signals
Receipts, outbound movement, and net flow must be visible together before replenishment pressure becomes an operational issue.
The report experience
Five decision chapters. One management story.
01 / Decision chapter
Executive Overview
Where did performance change, and where should leadership look next?
View approved gallery ↗Inside the platform
A complete analytical path from files to decisions.
Each layer has a distinct job: preserve source truth, normalize operations, shape the analytical grain, govern access, and deliver decision-ready measures.
- 01GenerateSynthetic source files
- 02StageLoad and inspect
- 03NormalizeSQL Server OLTP
- 04ModelDimensional warehouse
- 05GovernTMDL + dynamic RLS
- 06AnalyzePower BI + DAX
Semantic model
Business relationships made inspectable.
Two fact tables, eight business dimensions, one security table, 81 measures, controlled filter direction, and explicit role-playing dates.
Read the model guide ↗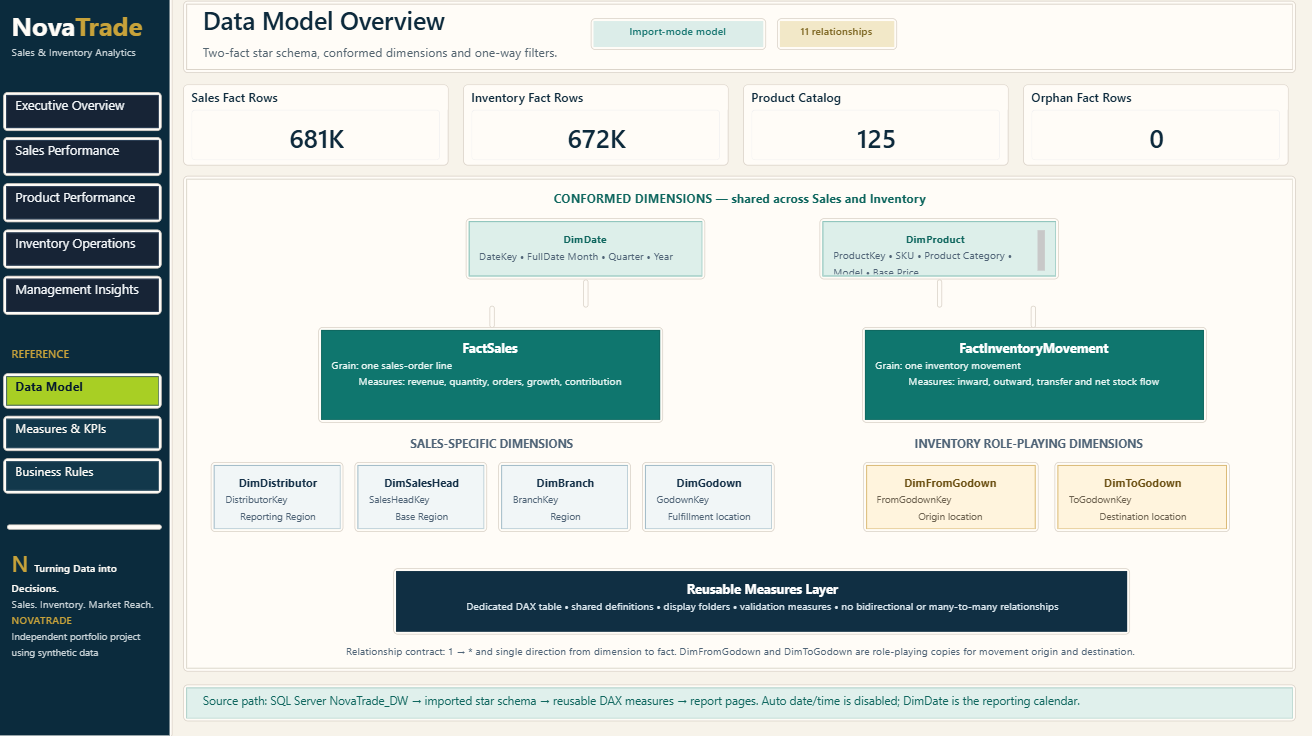
Trust is part of the product
Polished reporting backed by visible controls.
The portfolio package makes the important engineering claims inspectable: access behavior, analytical logic, documentation, validation, and release history.
Dynamic branch-level RLS
Regional, executive, inactive, and unknown-user behavior is documented, tested, and validated in Power BI Service.
Review RLS design ↗Automated release gates
Analytical, PBIP, structure, accessibility, privacy, formatting, and CI checks protect the package.
Inspect CI history ↗Source to semantic model
Python generation, staged SQL loads, normalized OLTP, warehouse ETL, PBIP source, and operating guides are included.
Open operations guide ↗Power BI Service validation
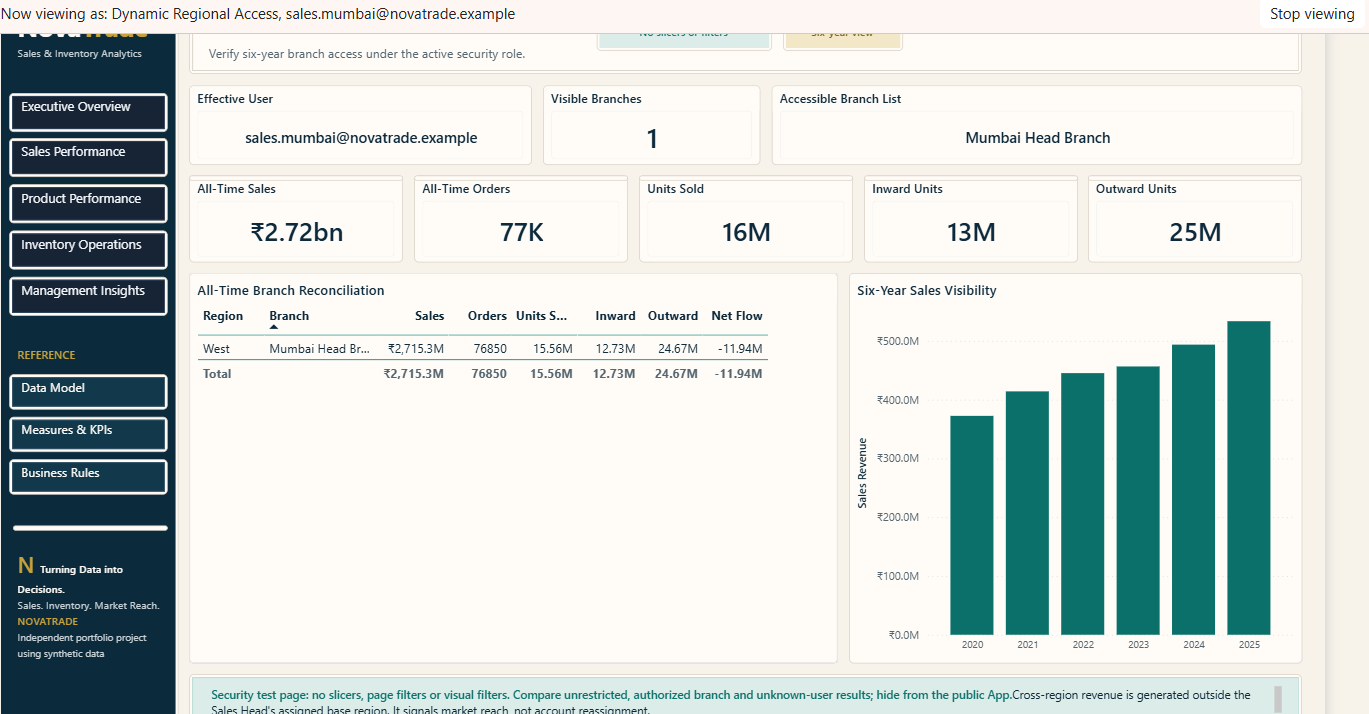
One visible branch. One reconciled regional view.
The live Service test shows the synthetic user sales.mumbai@novatrade.example resolving to Mumbai Head Branch with one visible branch and Mumbai/West-only reconciliation.
Released and reviewable
Explore the evidence behind the interface.
NovaTrade v1.0.0 is an independent portfolio project by Shamsh Tabrez Shaikh, delivered from synthetic source data through SQL Server, Power BI, automated validation, Service deployment, and verified dynamic RLS.